Alert integrations (FREE)
- Introduced in GitLab Ultimate 12.4.
- Moved to GitLab Free in 12.8.
GitLab can accept alerts from any source via a webhook receiver. This can be configured generically or, in GitLab versions 13.1 and greater, you can configure External Prometheus instances to use this endpoint.
Integrations list
Introduced in GitLab Free 13.5.
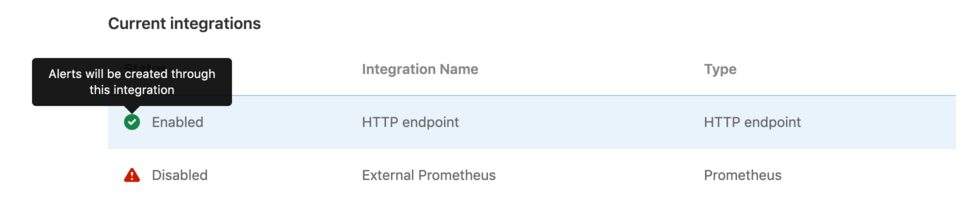
With Maintainer or higher permissions, you can view the list of configured alerts integrations by navigating to Settings > Operations in your project's sidebar menu, and expanding Alerts section. The list displays the integration name, type, and status (enabled or disabled):
Configuration
GitLab can receive alerts via a HTTP endpoint that you configure, or the Prometheus integration.
Single HTTP Endpoint (FREE)
Enabling the HTTP Endpoint in a GitLab projects activates it to receive alert payloads in JSON format. You can always customize the payload to your liking.
- Sign in to GitLab as a user with maintainer permissions for a project.
- Navigate to Settings > Operations in your project.
- Expand the Alerts section, and in the Integration dropdown menu, select Generic.
- Toggle the Active alert setting to display the URL and Authorization Key for the webhook configuration.
HTTP Endpoints (PREMIUM)
Introduced in GitLab Premium 13.6.
In GitLab Premium, you can create multiple unique HTTP endpoints to receive alerts from any external source in JSON format, and you can customize the payload.
-
Sign in to GitLab as a user with maintainer permissions for a project.
-
Navigate to Settings > Operations in your project.
-
Expand the Alerts section.
-
For each endpoint you want to create:
- In the Integration dropdown menu, select HTTP Endpoint.
- Name the integration.
- Toggle the Active alert setting to display the URL and Authorization Key for the webhook configuration. You must also input the URL and Authorization Key in your external service.
- (Optional) To generate a test alert to test the new integration, enter a sample payload, then click Save and test alert payload. Valid JSON is required.
- Click Save Integration.
The new HTTP Endpoint displays in the integrations list. You can edit the integration by selecting the {pencil} pencil icon on the right side of the integrations list.
External Prometheus integration
For GitLab versions 13.1 and greater, read External Prometheus Instances to configure alerts for this integration.
Customize the alert payload outside of GitLab
For all integration types, you can customize the payload by sending the following
parameters. All fields are optional. If the incoming alert does not contain a value for the Title field, a default value of New: Incident will be applied.
| Property | Type | Description |
|---|---|---|
title |
String | The title of the incident. |
description |
String | A high-level summary of the problem. |
start_time |
DateTime | The time of the incident. If none is provided, a timestamp of the issue is used. |
end_time |
DateTime | For existing alerts only. When provided, the alert is resolved and the associated incident is closed. |
service |
String | The affected service. |
monitoring_tool |
String | The name of the associated monitoring tool. |
hosts |
String or Array | One or more hosts, as to where this incident occurred. |
severity |
String | The severity of the alert. Case-insensitive. Can be one of: critical, high, medium, low, info, unknown. Defaults to critical if missing or value is not in this list. |
fingerprint |
String or Array | The unique identifier of the alert. This can be used to group occurrences of the same alert. |
gitlab_environment_name |
String | The name of the associated GitLab environment. Required to display alerts on a dashboard. |
You can also add custom fields to the alert's payload. The values of extra parameters aren't limited to primitive types (such as strings or numbers), but can be a nested JSON object. For example:
{ "foo": { "bar": { "baz": 42 } } }NOTE: Ensure your requests are smaller than the payload application limits.
Example request:
curl --request POST \
  --data '{"title": "Incident title"}' \
  --header "Authorization: Bearer <authorization_key>" \
  --header "Content-Type: application/json" \
  <url>
The <authorization_key> and <url> values can be found when configuring an alert integration.
Example payload:
{
  "title": "Incident title",
  "description": "Short description of the incident",
  "start_time": "2019-09-12T06:00:55Z",
  "service": "service affected",
  "monitoring_tool": "value",
  "hosts": "value",
  "severity": "high",
  "fingerprint": "d19381d4e8ebca87b55cda6e8eee7385",
  "foo": {
    "bar": {
      "baz": 42
    }
  }
}
Triggering test alerts
Introduced in GitLab Free in 13.2.
After a project maintainer or owner configures an integration, you can trigger a test alert to confirm your integration works properly.
- Sign in as a user with Developer or greater permissions.
- Navigate to Settings > Operations in your project.
- Click Alerts endpoint to expand the section.
- Enter a sample payload in Alert test payload (valid JSON is required).
- Click Test alert payload.
GitLab displays an error or success message, depending on the outcome of your test.
Automatic grouping of identical alerts (PREMIUM)
Introduced in GitLab Premium 13.2.
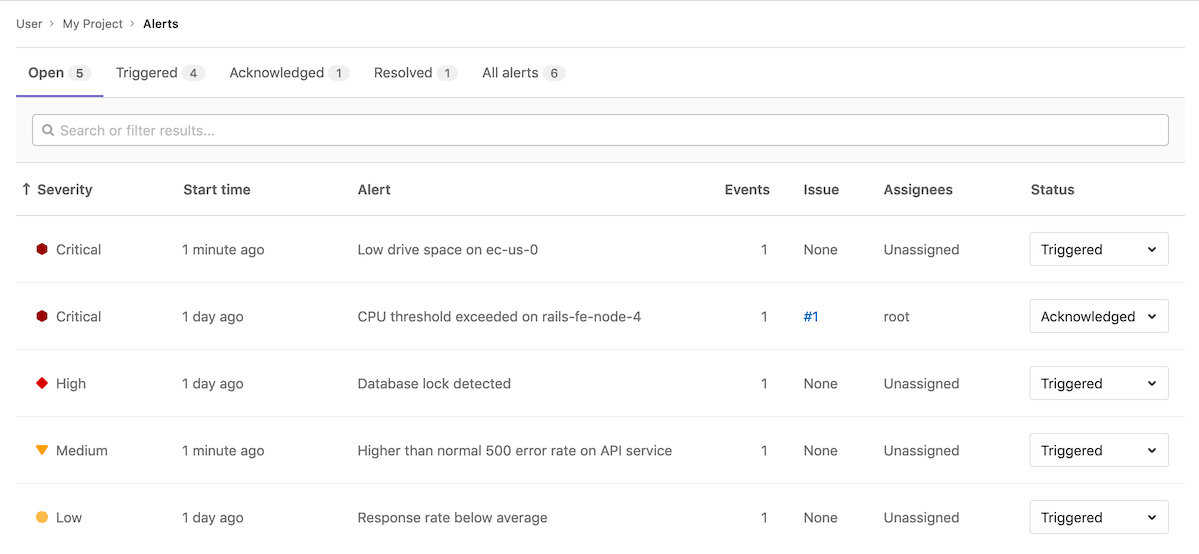
In GitLab versions 13.2 and greater, GitLab groups alerts based on their
payload. When an incoming alert contains the same payload as another alert
(excluding the start_time and hosts attributes), GitLab groups these alerts
together and displays a counter on the Alert Management List
and details pages.
If the existing alert is already resolved, GitLab creates a new alert instead.
Link to your Opsgenie Alerts
Introduced in GitLab Premium 13.2.
WARNING: We are building deeper integration with Opsgenie and other alerting tools through HTTP endpoint integrations so you can see alerts in the GitLab interface. As a result, the previous direct link to Opsgenie Alerts from the GitLab alerts list is deprecated in GitLab versions 13.8 and later.
You can monitor alerts using a GitLab integration with Opsgenie.
If you enable the Opsgenie integration, you can't have other GitLab alert services active at the same time.
To enable Opsgenie integration:
- Sign in as a user with Maintainer or Owner permissions.
- Navigate to Operations > Alerts.
- In the Integrations select box, select Opsgenie.
- Select the Active toggle.
- In the API URL field, enter the base URL for your Opsgenie integration,
such as
https://app.opsgenie.com/alert/list. - Select Save changes.
After you enable the integration, navigate to the Alerts list page at Operations > Alerts, and then select View alerts in Opsgenie.